What a green GitHub graph doesn't show
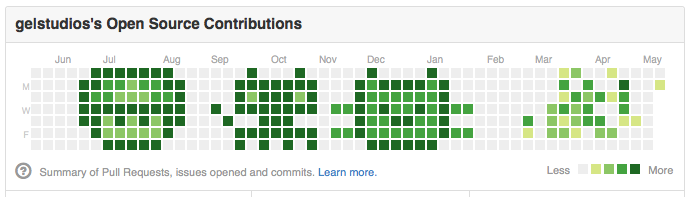
The GitHub contributions graph is the dashboard visible on a user’s GitHub profile page. It shows the number of contributions you’ve made to repositories over the past year. Contributions are marked on each day with a different shade of green, depending on how much you did that day relative to the rest of the year.
A contribution is defined as:
- opening an issue
- creating a pull request
- reviewing a pull request
- making a code commit
Most of your contributions probably come from commits, especially when starting out and working on personal projects only.
It’s really pleasing to see green on your graph. Maintaining a green chain of squares can be a powerful motivator for building a daily coding habit. It gamifies the whole process of writing and committing code each day.
It also gives an insight to potential employers and other curious people into how often you code, and can be taken into account during the hiring process. This is wrong.
Now I love the GitHub dashboard and its little green square. I once managed a streak of over 100 days! It’s an interesting personal scorecard of my coding habits. But I would never use it as a metric when deciding how capable a developer someone is, or something as serious as whether to hire them. Here are my reasons, focussing on commit contributions:
- Contributions don’t represent effort or time spent. A commit could be a feature you spent two hours on, or it could be a quick-fix that took two minutes.
- Contributions don’t represent lines of code. A commit that changes one character is represented the same way as a ten file commit on the graph. (Although please don’t interpret this as me saying that you have to write lots of code for it to be valuable - important bug fixes can take one character, and sometimes deleting code is the solution too.)
- When you’re trying to maintain a streak, it can discourage you from researching and studying new things, as you’re focussed on spending time writing code instead. It also forces you to do something just to commit it. Some days it can be more valuable to experiment and learn without committing a complete feature to your codebase.
- It discourages you from using other platforms to create code. You can build amazing things on Glitch, CodePen, JSFiddle, etc but not receive a green square for it.
- GitHub contribution history can be easily manipulated and faked. There are a tonne of tools out there that let you edit your past contributions, sometimes with arty effects like this repo:
A green GitHub contributions graph looks cool (at least in my opinion), and can help encourage you to build a daily coding habit. However, it isn’t a reliable indicator of how capable or committed a developer is, or how much code they write. The job of a developer does not only involve writing code. There are many ways to learn and contribute as developer that the GitHub graph cannot capture, and therefore makes it a false representation of a developer’s ability.
That being said, images like this still make me happy: